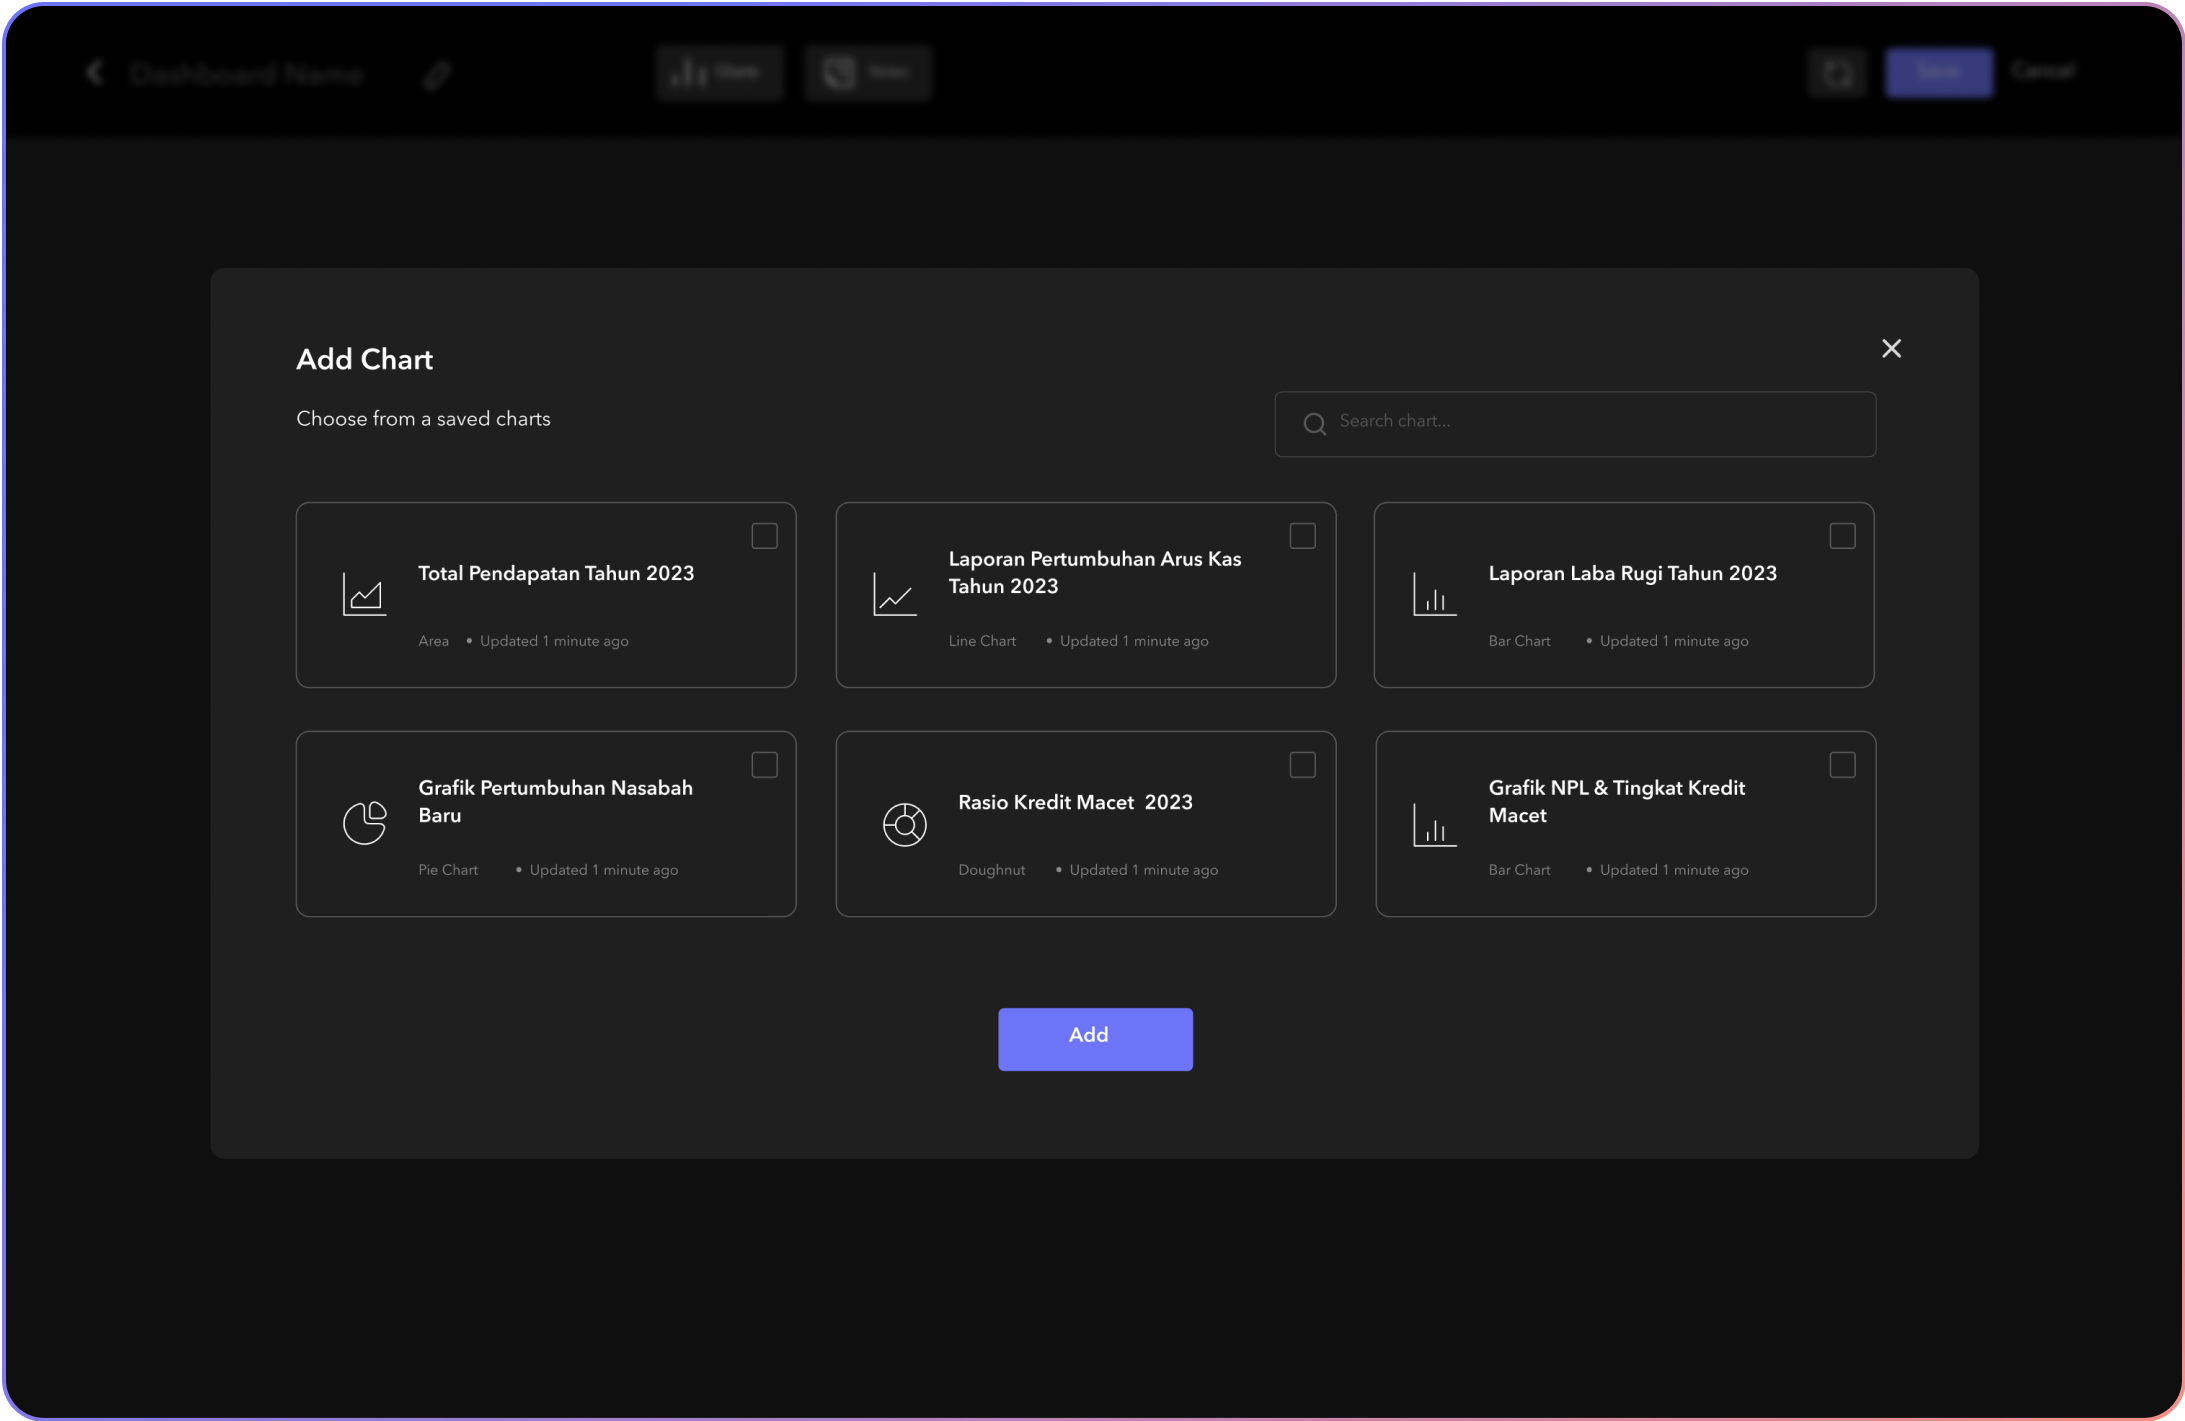
- Open Dashboard, On the right side click Edit button. You’ll see the Add Chart option appear on the left side.
- Add Chart, Choose the chart you’ve created or use the updated chart features for enhanced visualization options.
Charts in Genesist are dynamic visual representations of your data, designed to help you understand trends, patterns, and outliers.