> ## Documentation Index
> Fetch the complete documentation index at: https://docs.soca.ai/llms.txt
> Use this file to discover all available pages before exploring further.
# Save Charts from Chat
> Learn how to create, customize, and manage charts within Genesist to visualize your data insights.
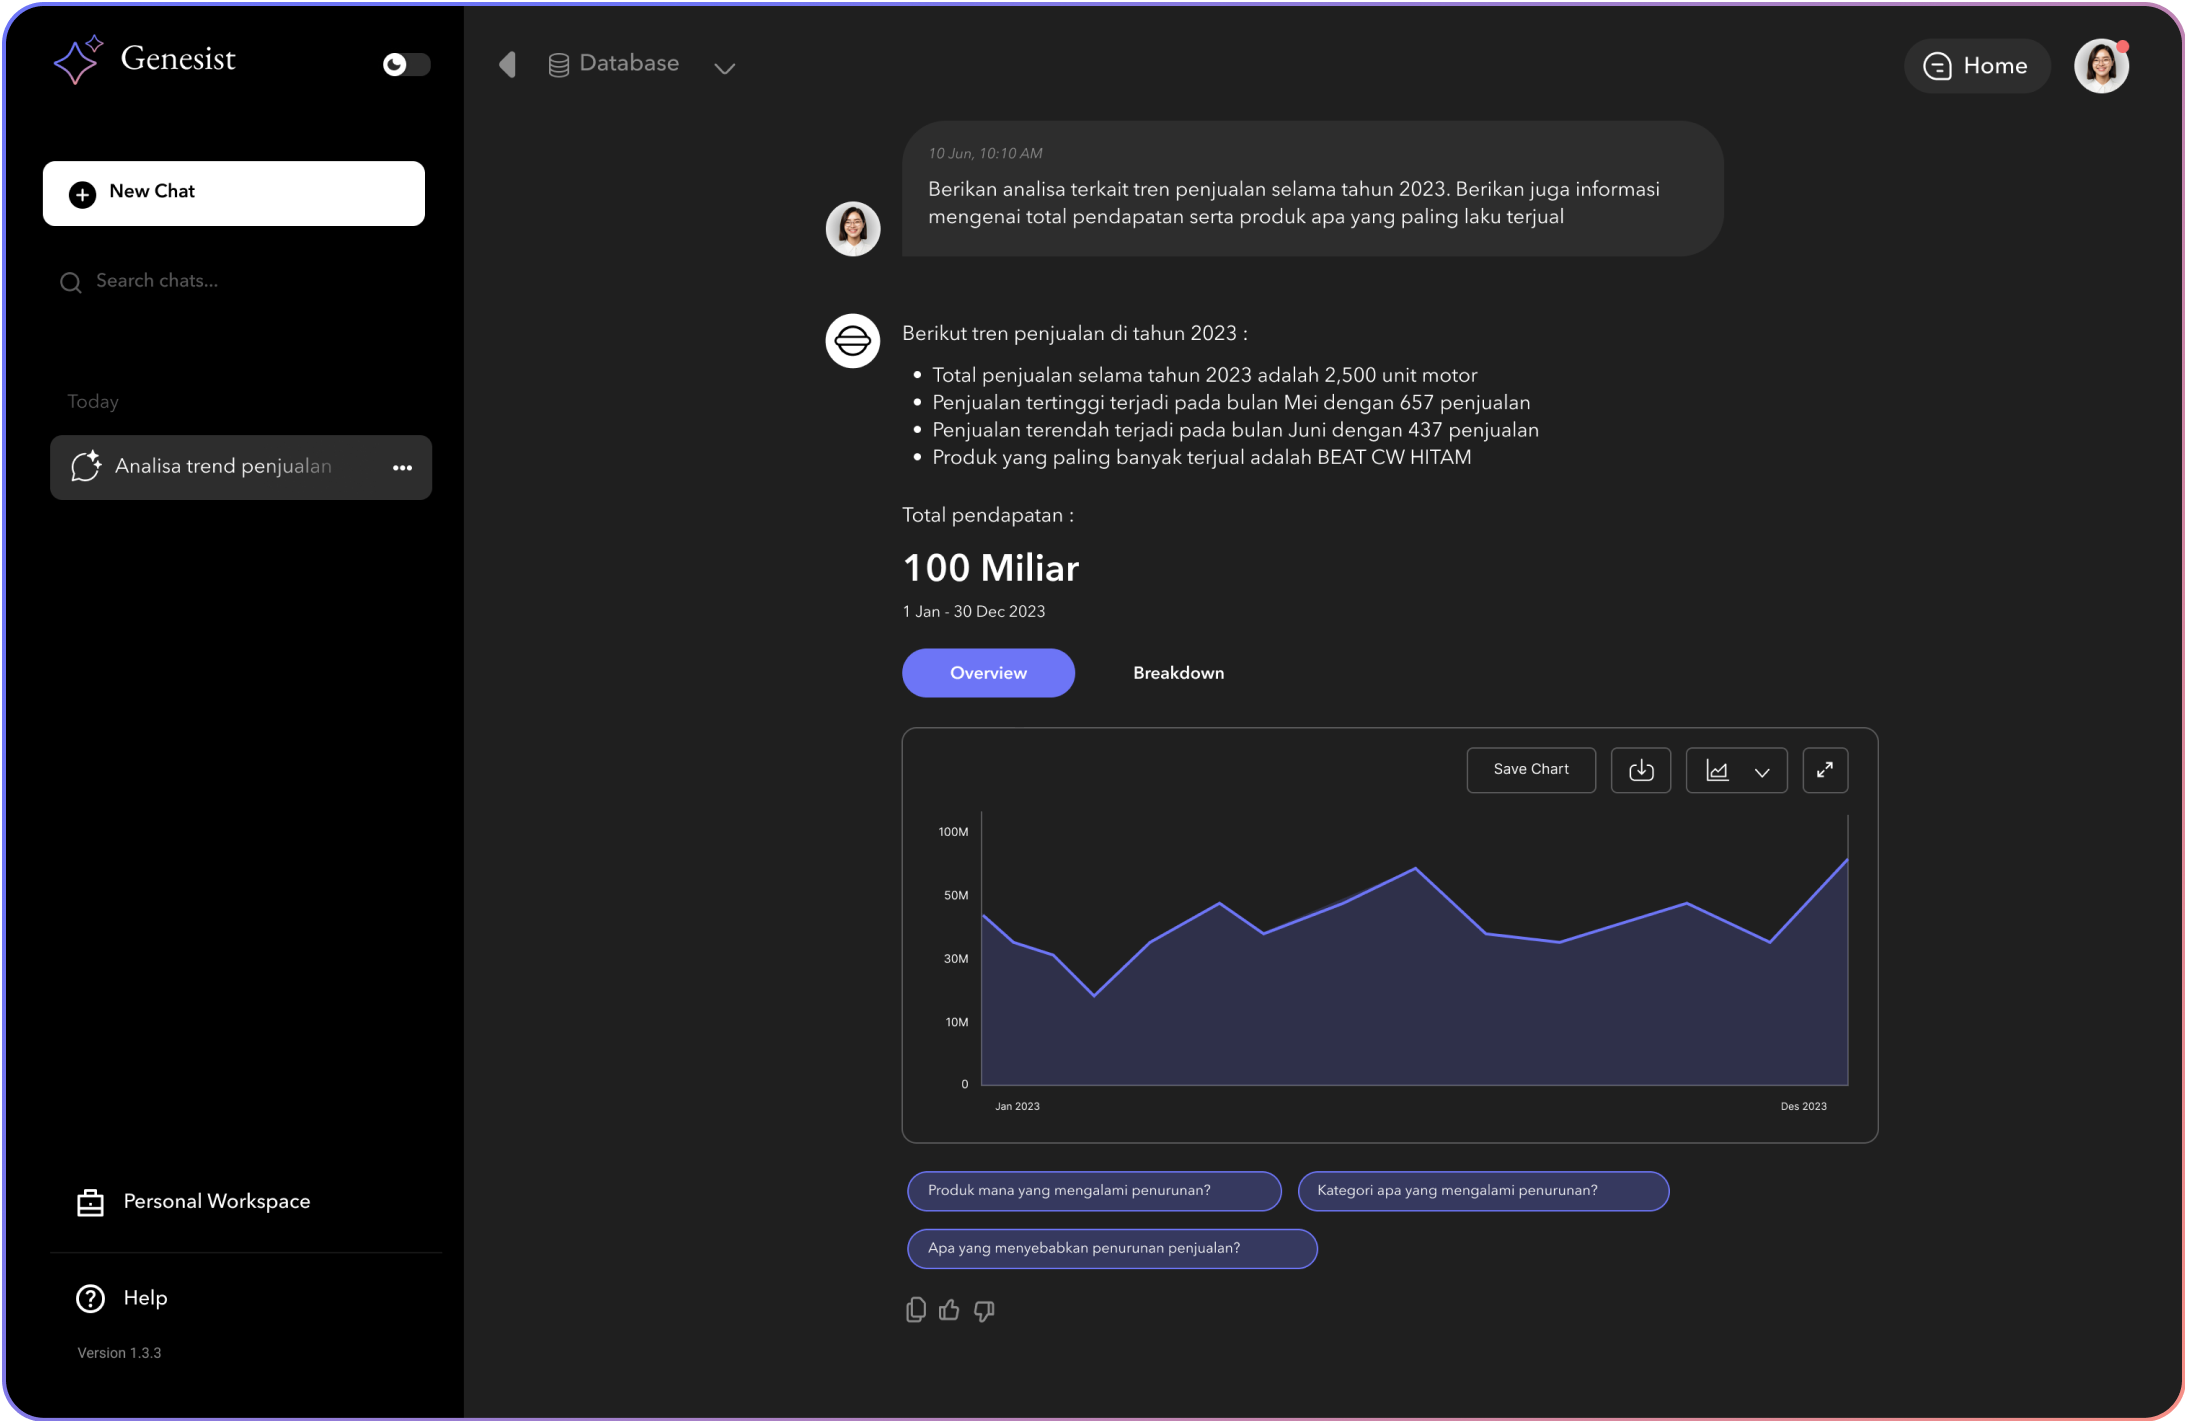 ### Creating a Chart
To create a chart, follow these steps:
* **Chat with Genesist**, On the home screen, select a data source and ask any questions about your data
* **Choose Chart Type & Save Chart**, Select the type of chart that best represents your data. Click **Save Chart** button to save the chart for future reference and add it to any dashboards.
### Creating a Chart
To create a chart, follow these steps:
* **Chat with Genesist**, On the home screen, select a data source and ask any questions about your data
* **Choose Chart Type & Save Chart**, Select the type of chart that best represents your data. Click **Save Chart** button to save the chart for future reference and add it to any dashboards.