> ## Documentation Index
> Fetch the complete documentation index at: https://docs.soca.ai/llms.txt
> Use this file to discover all available pages before exploring further.
# Add Chart to Dashboard
> Charts in Genesist are dynamic visual representations of your data, designed to help you understand trends, patterns, and outliers.
With a variety of chart types and customization options, you can create visualizations that best suit your analysis needs.
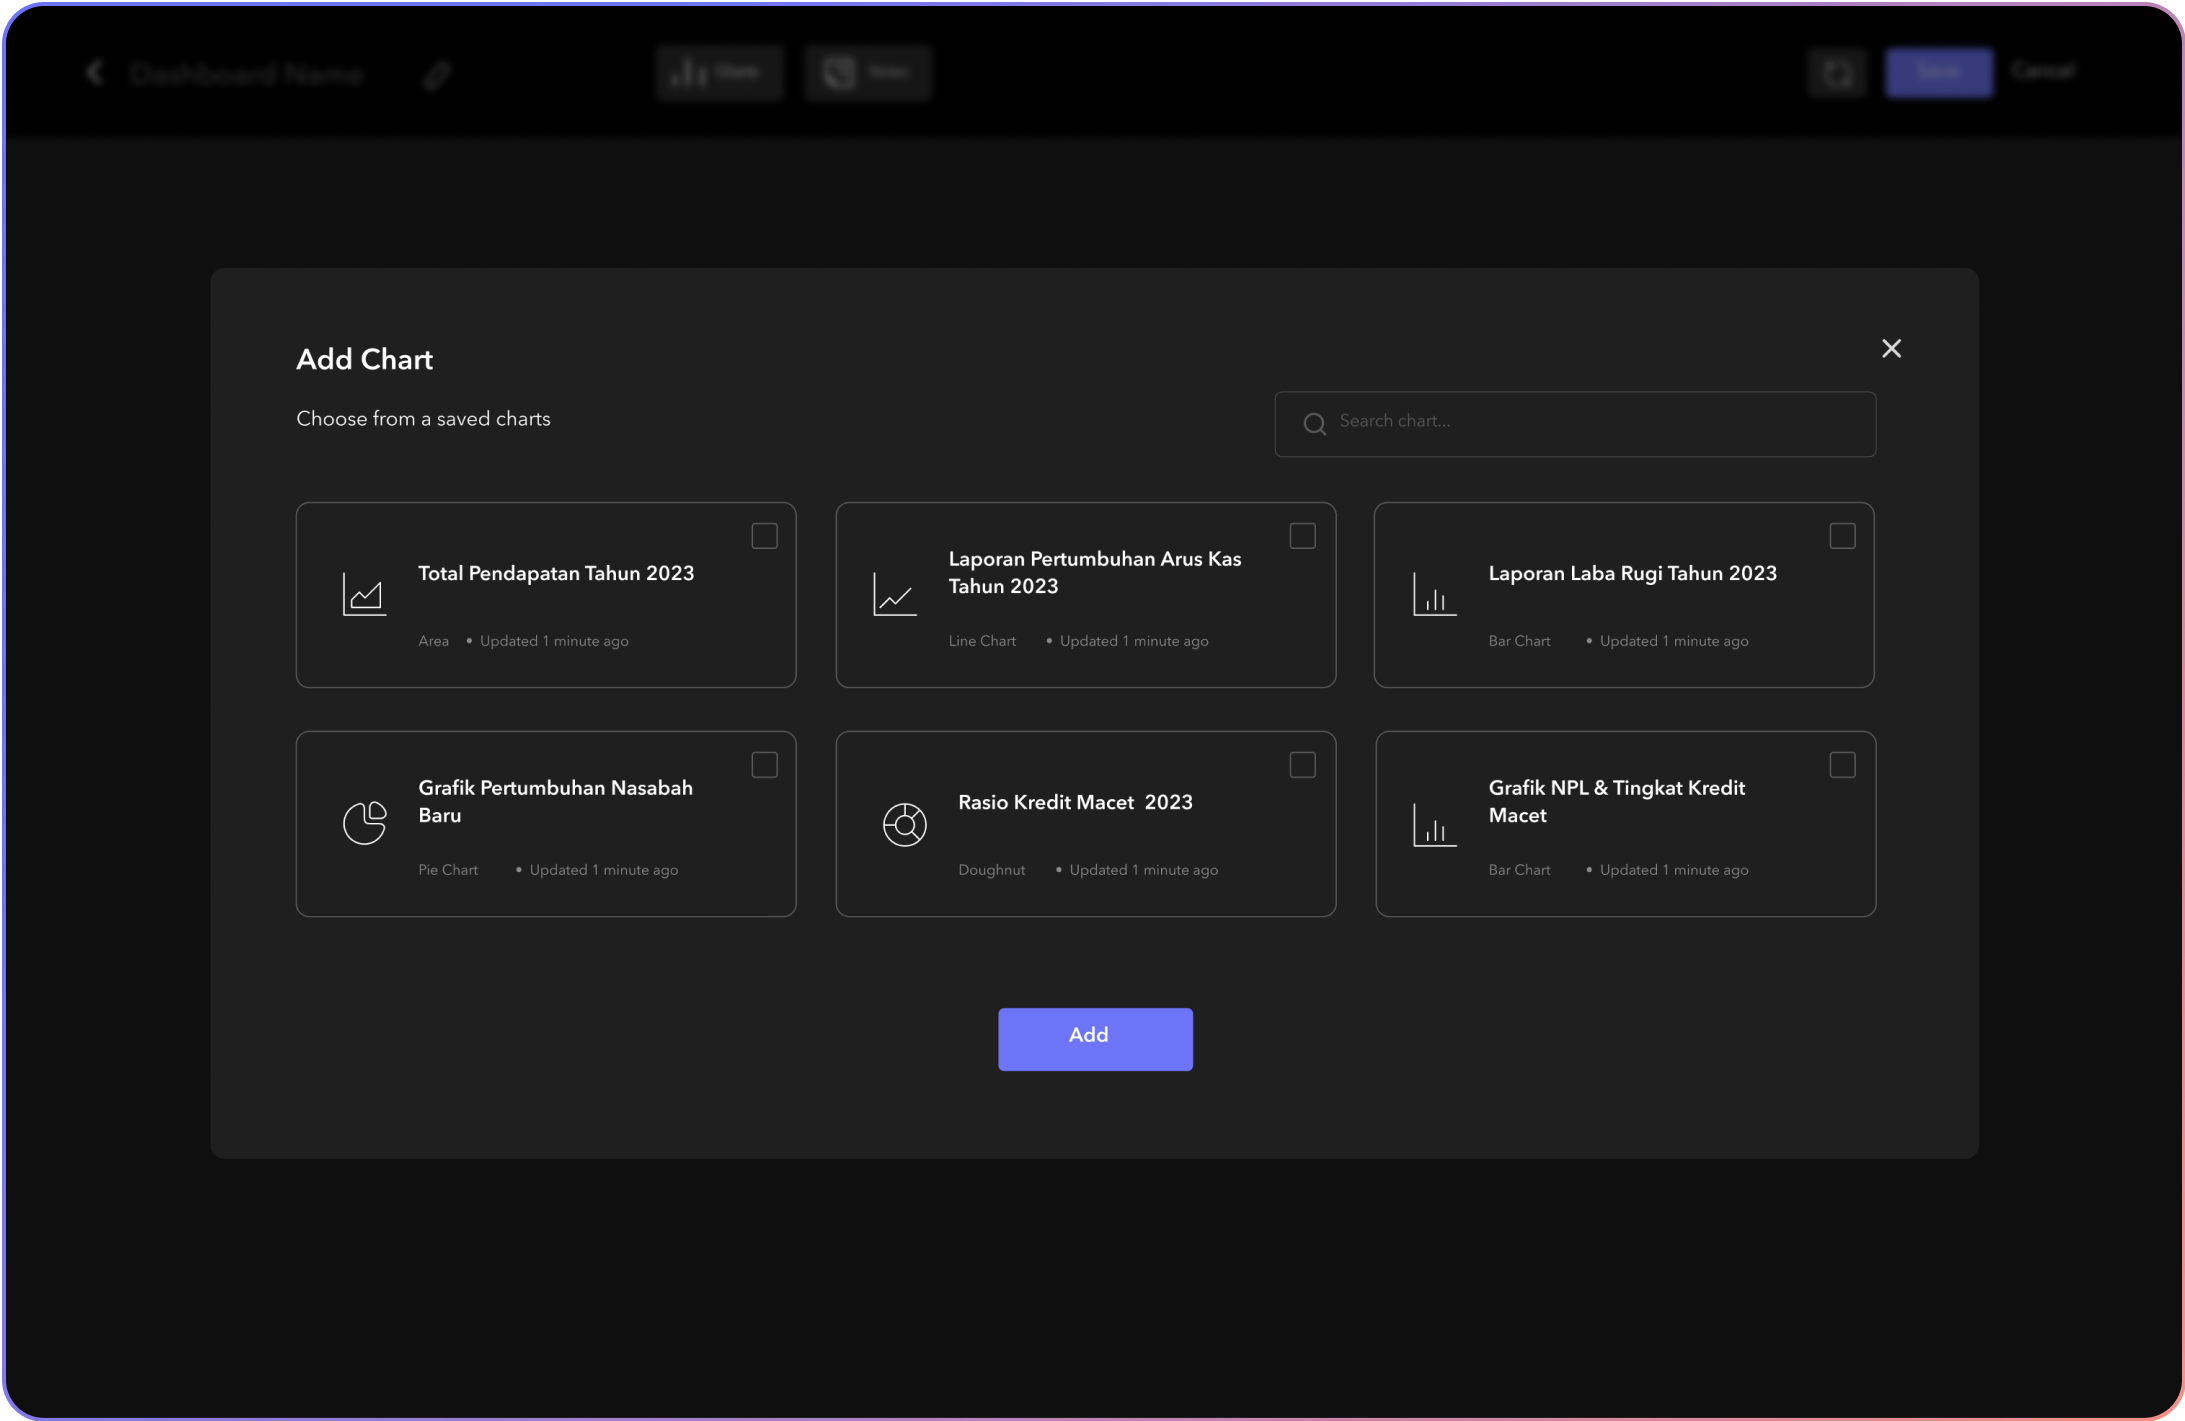 How to add a chart to dashboard, follow these steps:
* Open Dashboard, On the right side click **Edit** button. You’ll see the **Add Chart** option appear on the left side.
* **Add Chart**, Choose the chart you’ve created or use the updated chart features for enhanced visualization options.
How to add a chart to dashboard, follow these steps:
* Open Dashboard, On the right side click **Edit** button. You’ll see the **Add Chart** option appear on the left side.
* **Add Chart**, Choose the chart you’ve created or use the updated chart features for enhanced visualization options.